Welcome to Optimism

Data is Beautiful

6a00d8341c823e53ef01bb090d8bae970d-800wi

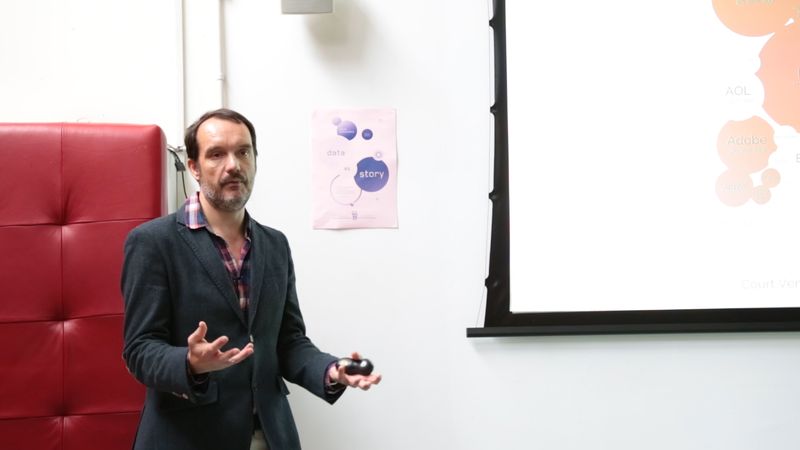
Author and designer David McCandless of Information is Beautiful fame visited our agency this morning as part of our ongoing series on storytelling. Over breakfast and a series of data visualisation graphics, McCandless showed us how sometimes dry, random seeming raw data can open up compelling narratives. For instance, what periods of the year trend toward breakups, according to Facebook status updates, and why? And what happens when you look at the billions of dollars and pounds spent on military force versus GDP? The connections aren’t always obvious and don’t always correlate directly, but they can reveal interesting stories.

For more on David McCandless and data visualisation, visit www.informationisbeautiful.net. Thanks to David for stopping by today!


Forever Curious: ‘Imagining Creative Futures’


forever curious 1

Much of W+K recently took a half-day out to volunteer for the latest installment of Forever Curious, the agency programme that sees us working with local kids to nurture their creativity. The latest theme, “My Creative Life,” was all about getting kids to reflect on and look forward to an inspired present and future.

We met kids from Newport School and Millfields School at Chats Palace Arts Centre in Hackney Wick for a session of word games and creative collaging. The curious kids were asked to think of words that represented creativity, themselves, and a word to describe their future with the help of our W+K volunteers. They also reflected on where they’d like to live and what they could see themselves doing years from now.

In the end, it was a day of many smiles and laughs for both the kids and volunteers, all powered by the kids’ infectious energy and imaginations.

forever curious 2

Forever curious 3

Loading